| Learning from the seminar of the new seismology | ||||||||||||||||||||
|
The method used in the ANS earthquake forecast
|
||||||||||||||||||||
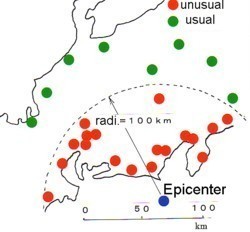
| The method used in the ANS earthquake forecast is as follows; Fig.1 shows the distinction of contents of reports with positions of observation. Red points show changes in the direction of the oil magnetic compass(more than 4 degrees), while green points show no change and light green no report. The scale of the predicted earthquake grows as the radius of the red-point area lengthens. Here's the reason; Prediction of the earthquake scale |
||||||||||||||||||||
 |
||||||||||||||||||||
| Fig.1 Positions of observation and the distinction of the contents of observations by colors |
||||||||||||||||||||
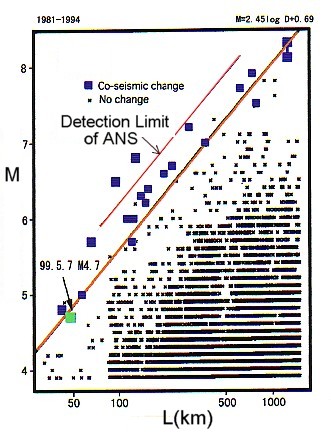
| Fig.2 shows the relations between the earthquake scale and the distance from the epicenter to Haibara Observatory of General Laboratory for Industrial Technology, where the level of underground water is observed. It means a M8 earthquake could be detected at the distance of 1,000 km. Relations between the distance from the epicenter L and the scale of the earthquake M can be described by the following formula. M=2.4logL+0.8
Fortunately, however, the sensitivity of ANS observation of oil magnetic compasses is presumed to be lower than that of underground water level observation. The fact isn't troublesome for ANS, as we aim at the forecast just before the big earthquake. It becomes difficult for us to predict big earthquakes if we concentrate too much on small tremors, which is just like looking at individual trees without looking at the forest. It's the big earthquake that we have to predict, so the poor sensitivity can be just right for the purpose. According to an ANS observer in Sendai City, his compass failed to detect the M6.2 earthquake which occurred 130 km away. When this condition〈M=6.2, L=100 km〉is taken into account, the detection limit of ANS can be formulated as follows;. M=2.4logL+1.4 |
 |
|||||||||||||||||||
| Fig.2 The relation between the earthquake scale and the distance from the epicenter of the earthquake to Haibara Observatory | ||||||||||||||||||||
 |
||||||||||||||||||||
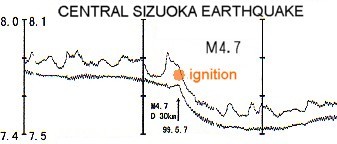
| Fig.3 Change in underground water level recorded around the M4.7 earthquake: The upper line shows the level recorded, while the lower line shows the value with changes in atmospheric pressure eliminated. The water level seems to pick up a little just before the earthquake. |
||||||||||||||||||||
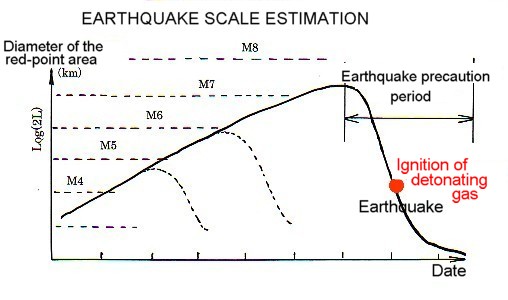
| Let me estimate the process of the earthquake from the starting of the deviation in oil magnetic compass to the actual occurrence by using this formula. Fig.3 shows a record of underground water level observed at Haibara Observatory at the time of a M4.7 earthquake. This figure will help you understand the process more easily. 1st stage: Reports of unusual deviation in oil magnetic compass start to come in around the epicenter of the earthquake. These reports are shown in red points on the map. When the earthquake epicenter is in the sea area, it takes some time for the red points to appear. 2nd stage: The red-point area spreads out in accordance with the scale of the earthquake. While the red-point area spreads, temperature around the magma chamber falls. It's when the dissociation of water is finished that the red-point area cease to spread. The scale of the earthquake can be estimated by the diameter(2L) of this red-point area. For example, when the diameter is 20 km, the scale of the earthquake is estimated at M3.8, and you need not worry about a big earthquake. But when the diameter grows to 200 km and 420 km, the scale of the arthquake is estimated at M6.2 and M7.0 respectively. And when it's 1,120km, the huge earthquake of M8 as one predicted in Tokai Region could occur. As the scale of the earthquake increases, it takes longer for the red-point area to cease to grow. There should be some change in the numbers above through future observations. 3rd stage: The number of red points start to decrease gradually when the dissociation of water is finished. At this stage, temperature around the magma chamber starts to rise. When the temperature reaches the ignition point, it explodes and the earthquake is caused. It is possible that all the red points disappear before the explosion. 4th stage: If the dissociation is slow enough, the expansion of the dissociated gas might not go beyond natural inflation and not result in explosion. When the earthquake(explosion) does occur, the same type of process will be repeated toward each aftershock. The prediction of the earthquake center The earthquake center, of course, is at the center of the red-point area. If the observation points are distributed densely enough, the earthquake center is predictable to some extent even when it is in sea area.
|
||||||||||||||||||||
| Fig.4 Illustration of the way of predicting the earthquake scale and the occurrence time | ||||||||||||||||||||
| The prediction of the occurrence date Fig.4 is to make the ANS method of earthquake prediction more easy to understand. The observation of underground water level shows the decline of the underground water level and the earthquake come almost at the same time. The underground water level starts to plunge right after the earthquake, but that's not the case with ANS observations. Probably that's The prediction of the depth and the damage The prediction of the depth and the damage of the earthquake is impossible just by observing magnetic compass. The depth of the earthquake center and the direction of explosion of dissociated water can affect the damage of the earthquake. So you must make an intensive observation by using gaussmeters when the red-point area starts to show signs of expansion. In case of sea-area earthquake in which the direction of the explosion is perpendicular to the sea surface, tidal waves can happen. |
||||||||||||||||||||
| BACK | ||||||||||||||||||||